Massive sunspots and huge solar flares mean unexpected space weather for Earth
If you still have your solar viewing glasses from the eclipse, now is a good time to slap them on and look up at the sun. You’ll see two big dark areas visible on our star. These massive sunspots are regions of intense and complicated magnetic fields that can produce solar flares – bursts of high-energy radiation. You can just make them out with solar viewing glasses, but they’re better viewed through a solar telescope.
These two huge sunspots are currently causing quite a bit of consternation and interest. The solar storms they’ve sent toward Earth may affect communications and other technologies like GPS and radio signals. They’re causing amazing displays of the Northern and Southern Lights. And space weather scientists like us are excited because we wouldn’t normally expect this much activity from the sun at the moment. The sun goes through 11-year cycles of solar activity. What scientists call a solar maximum is the time in the cycle when the sun is putting out the most energy. That’s when we tend to see the most sunspots, solar flares and associated solar storms. Some solar maxima are larger or more active than others – such as the 1990-1991 solar max. But this last cycle, which peaked in 2014, was quite small, and there were few large geomagnetic storms. 
We’re heading into the bottom of solar minimum, when the sun tends to have fewer sunspots, solar flares and coronal mass ejections – large expulsions of plasma, electrons and ions, and magnetic fields. But despite where we are in the sun’s cycle, activity on the sun has dramatically picked up over the past few days. On and off, these two sunspots have been flaring and shooting out coronal mass ejections, directed toward Earth. So what’s going on with the sun? And should we be concerned about this somewhat out-of-character solar behavior? Here’s what’s happened so farOn September 4, the sun started sputtering. A moderately large flare (classified as an M5.5) erupted at approximately 18:30 UTC. It produced a coronal mass ejection aimed at Earth. The sun continued to flare on September 5. A solar energetic particle event from the previous day’s activity arrived at the Earth, where it likely affected radio communications as well as the health of satellite systems. On September 6, the sun produced two massive X-class flares. This is the category for the strongest of all solar flares.
NASA announced one was the most powerful since at least 2008. It produced another coronal mass ejection. 
Over the next day, the same sunspots continued to spit out more solar flares. It took about an hour for the solar energetic particles they emitted to arrive at Earth. These protons are incredibly fast-moving. They can affect communication systems, typically in the polar regions where they are more likely to enter into the Earth’s atmosphere. As with all increases of radiation in space, they can also affect satellite systems and the health of astronauts. Early in the morning hours of September 7 in the U.S., that first coronal mass ejection that erupted from the sun three days earlier arrived at Earth. Because of the way its magnetic field aligned with Earth’s, it generated only a small geomagnetic storm. After being detected by spacecraft upstream from Earth in the solar wind, the massive coronal mass ejection from September 6 also hit Earth on the evening of September 7 EDT. Its arrival was a few hours earlier than space weather forecasting agencies around the world predicted. 
What other effects will Earth see?All this solar activity has already caused a couple of radiation storms in Earth’s high latitude regions that blacked out radio communication at certain frequencies. The impacts extended toward the equator and have affected high-frequency communications, including ham radios, which are used in emergency and disaster relief management. Radio fade-out maps from the Australian Bureau of Meteorology show that high-frequency radio communication disruptions have likely occurred in the same areas being pummeled by Hurricane Irma. There has likely been a loss of global navigation system satellite communications in those same areas, but it will take time for the data to be analyzed and for us to gain a full understanding of how this space weather activity has affected those on the ground. The radiation storms may also force flights over the polar regions to reroute to avoid increased radiation exposures for people on board and potential loss of communication and navigation systems for aircraft on these paths. With the collision of the coronal mass ejection from this X-class flare with Earth come other impacts for the near-Earth space environment. Geomagnetic storms, like the one currently in progress, are known to wreak havoc on a range of satellite and ground-based communication technologies, as well as power grids, GPS/GNSS, and orbit predictions of satellites and space debris. It is also very likely to produce dazzling aurora activity as far south as the northern U.S. and Europe in the Northern Hemisphere, and as far north as southern Australia and New Zealand in the Southern Hemisphere. While scientists and aurora-hunting enthusiasts closely watch the storm’s ongoing effects, others will be bracing for problems and disruptions to the many technological services that will be affected. We don’t need to worry about this coronal mass ejection being “the big one” – a solar storm direct hit that could cause widespread power blackouts and trigger as much as US$2 trillion worth of damage, according to a National Academy of Sciences study. But this storm, on the back of this month’s abnormally active space weather, may wind up on the larger end of the scale, and will be the subject of lots of analysis and research. 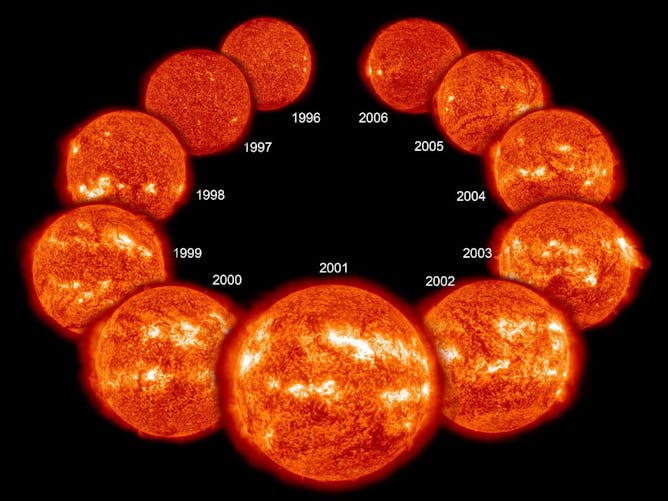
We don’t yet fully understand everything that is happening. But the activity over the past few days, when the sun should be within its quietest period, shows that significant space weather events are possible at any stage of the 11-year solar cycle. You can help us study this and other solar storms as a citizen scientist. Sign up for Aurorasaurus and let us know if you observe aurorae with this event. Alexa Halford, Researcher in Physics and Astronomy, Dartmouth College; Brett Carter, Senior Research Fellow, RMIT University, and Julie Currie, Research Officer, RMIT University This article was originally published on The Conversation. Read the original article.
0 Comments
 Name: Christine Gabrielse Institution (Location): University of California, Los Angeles Degree(s): Ph.D., Geophysics & Space Physics, UCLA, Los Angeles, CA B.S., Space Sciences, Florida Institute of Technology, Melbourne, FL Current and past missions/projects: NASA THEMIS Mission, SuperDARN Radar, GO-Canada (imagers, riometers) Research Interests: How energy is transferred within the magnetosphere and from the magnetosphere to Earth's upper atmosphere (the ionosphere)
High school was similar...I hated memorizing terminology for biology and chemistry, but when I started physics class I couldn't get enough. I was just so amazed that math went beyond equations that you work out on paper (which I thought was boring!), and could actually be used to elegantly describe exactly how things move and interact with each other in time and space. My brain just exploded when I learned that we could figure out how far away a star is using "parallax", the same way our two eyes help us to judge distance! Although I had other interests and hobbies, my "guiding star" (pun intended) when it came to choosing a career path was this deep, innate feeling that I wanted to dedicate my life to something that would really push humanity forward to new and better places. It is probably the same sense that motivates any explorer and frontiersman, and I felt that outer space really was the "final frontier" left to explore. So, I packed my bags for the Floridian space coast and began my trajectory towards space physicist. While studying for my bachelor's degree, I had the amazing opportunity to do undergrad research with a space physics professor who introduced me to space weather. Because I had a year's experience under my belt studying the very space weather phenomenon that the THEMIS mission was designed to observe, it was the perfect match to move out to UCLA for my Ph.D. The rest, I guess, is history!
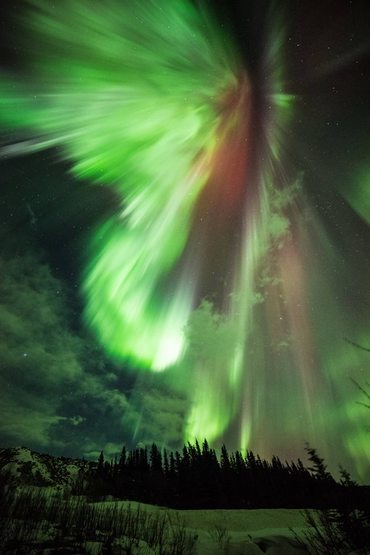 Image thanks to AGU Space Facebook page. Image thanks to AGU Space Facebook page.
Other than that, my day-to-day involves research meetings and seminars, paper writing, conference organizing, and in the past student advising. The meetings are for scientists in my research group to share their progress and get feedback on their ideas and methodology. Seminars are more formal presentations that usually include results. It's a good way to get you out of your little bubble and thinking about different areas of research.
  Name: Quintin Schiller Institution (Location): NASA Goddard Space Flight Center (Greenbelt, MD) Education: Ph.D. + M.S. in Aerospace Engineering Sciences, University of Colorado - Boulder, 2015; B.S. in Physics and Astrophysics, University of Wisconsin - Madison, 2007 Current and past missions/projects: Colorado Student Space Weather Experiment (CSSWE), Van Allen Probes REPT Instrument, Compact Radiation belt Explorer CubeSat (CeREs - formerly CREPT) Research Interests: Space plasma physics, Earth's radiation belts, energetic particle instrumentation, CubeSats
To truly understand why space science plays such an important role in our everyday lives, we must answer a simple, but fundamental question: “What is the Sun?“ From Encyclopædia Britannica, “sun” is defined as “star around which Earth and the other components of the solar system revolve“. Okay, sounds right, but then what exactly is a star? Again from Encyclopædia Britannica, “star“ is “any massive self-luminous celestial body of gas that shines by radiation derived from its internal energy sources“. So, putting those two definitions together we could say that the Sun is “the massive self-luminous celestial body of gas that shines by radiation derived from its internal energy sources around which Earth and the other components of the solar system revolve“. Simple, right? Let’s break that down a bit, starting with the simplest part, the end. The Sun is the center of our solar system and all of the planets, including the Earth, revolve or orbit around it. Of course, we didn’t always know or believe that, but that’s a story for a different post. Heading back to the beginning of the definition, we see the word “massive“. Massive here is used in the most literal meaning of the word. The Sun is by far the most significant object in our solar system, making up more than 98% of the total mass. It’s 333,000 times more massive than the Earth, meaning it is made up of that much more matter. In literal dimensions, you could line up more than 100 Earths across the equator of the Sun and fit over 1 million Earths inside the Sun. That’s pretty huge when we think on a human or even a global scale, but keep in mind that the Sun is just a mid-size star!  The Earth shown next to the limb of the Sun and an erupting solar flare. The sunspots frequently visible on the surface of the Sun are usually about the size of a few Earths. Image credit: NASA So, next we’ll focus on the “body of gas” part of the definition. So, in elementary school you probably learned that there are three forms of matter: solid, liquid, and gas. Well, that’s not entirely true (“gasp“), there’s actually a fourth state of matter known as plasma. Really, it can be considered a special type of gas, an ionized gas, but since that ionization causes it to act in ways that are very different than a regular gas, it should be (and usually is) considered its own state of matter. Unlike regular gases, plasmas are electrically conductive and respond to electromagnetic forces. You’re probably extremely familiar with plasmas and their applications, without even realizing it: lightning, electric sparks, fluorescent and neon lights, and some TVs. So the Sun is actually a body of ionized gas (or plasma). Finally, the most important parts of the definition that truly define a star are “self-luminous” and “shines by radiation derived from its internal energy sources“. These statements refer to the fact that the Sun and other stars actually produce their own light (or radiation), unlike planets and the Moon which simply reflect light from the Sun. So what are these internal energy sources that are mentioned? Well, the inner cores of stars are the only natural environments (that we know of) where it’s hot enough (27,0000,000° F) and high enough density (150 g/cm³, roughly 10 times denser than lead) for nuclear fusion to take place. Nuclear fusion is the combination of smaller atoms of elements to make larger ones. In the cores of stars like our Sun, the lightest element, hydrogen (H), is converted into the second lightest element, helium (He), in a three-step process known as the proton-proton or “pp” chain” (cue giggling). 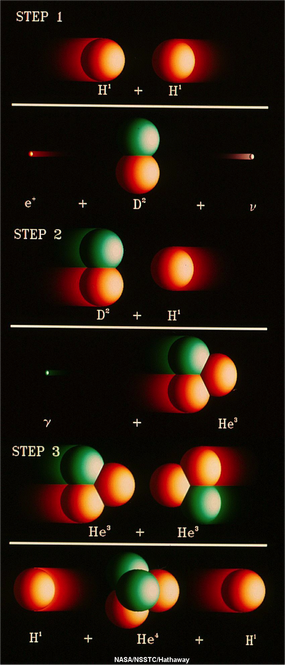 This image shows the steps of the proton-proton (pp) chain, the nuclear fusion reaction that converts hydrogen (H) into helium (He) in the core of the Sun. In the first step two protons collide to produce deuterium, a positron, and a neutrino. In the second step a proton collides with the deuterium to produce a helium-3 nucleus and a gamma ray. In the third step two helium-3s collide to produce a normal helium-4 nucleus with the release of two protons. Image credit: NASA In this reaction, four hydrogen atoms are converted into a single helium atom. That sounds all well and good, but it doesn’t quite explain why that conversion results in the massive energy production that we all know occurs in the Sun. The secret to that comes from what is probably the most famous equation in all of science: the mass-energy equivalence equation (E=mc²).  The mass-energy equivalence equation, derived by Albert Einstein in 1905, explains the energy release of the nuclear fusion reactions that power stars. Image credit: Pax on both houses You’ve probably seen that equation once or twice, and you probably know that it was introduced by arguably the most famous scientist ever Albert Einstein, and you probably incorrectly think that that’s why Einstein won the 1921 Nobel Prize in Physics (he actually won it for a different discovery he made in 1905, something known as the photoelectric effect). Anyway, this simple equation is the reason why the Sun is the most powerful energy source known to man. Remember those four little hydrogen atoms? The combined mass of those four hydrogen atoms (4 x 1.6605402 x10–27 kg = 6.64187×10⁻²⁷ kg) is actually less than the mass of the one new helium atom ( 6.64648×10⁻²⁷ kg). Note that the difference is miniscule, a mere 4.61×10⁻³⁰ kg, but looking at Einstein’s equation, that tiny mass is multiplied by a really large number, the speed of light squared (8.98755179×10¹⁶ m2/s2). That means that the total energy released by each pp chain is 4.14326137×10⁻¹³ kg·m2/s2 (or Joules). That’s 1×10-19kW·h, the basic unit by which electric companies charge for usage. So each reaction is actually liberating only a tiny bit of energy, but when you multiply that by the enormous amount of mass in the Sun and mind-boggling number of reactions that are occurring in the core, you can see the energy add up. 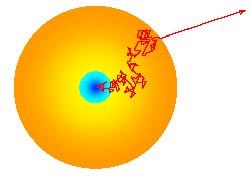 The “random walk” that a photon of light takes to get from the core to the surface of a star can take tens or even hundreds of thousands of years! Image credit: askamathematician.com But the really crazy fact is that even once the light is emitted from the core in the form of a photon, it takes tens or even hundreds of thousands of years (estimates range from 17,000 to 1 million) for the photon to actually reach the surface of the Sun and escape out into space. That’s because the photon can be randomly emitted in any given direction, not necessarily towards the surface. Then, because the Sun is so dense, it doesn’t travel very far before the photon bumps into another atom and is absorbed. Then that photon is emitted again in a random direction. This all adds up to a really, really long “random walk” through the Sun to the surface.
This post was originally written by Ian Cohen for his blog "At the Center of It All"  This year seems to be a year of action. Standing up for scientists being able to freely share their ideas and results, standing up for scientists being allowed to go to conferences and to collaborate, and of course standing up for civil liberties and the values that make us a wonderful country. Along with this, there have been quite a few opinion pieces in some of the big news organizations about whether or not science and scientists should be political (Vox.com The New York Times Forbes Slate The Washington Post and many more). Science has always been political, if you've ever been to a faculty meeting, organized a conference, or even just talked with colleagues over beers, you can see/hear about some of the politics in science. Granted this isn't what the news articles were referring to. So the questions stands, should science and really scientists be involved and speak about politics?
I think there are two answers, so lets take the easiest first. Should science be political? No. Science, the act of researching and presenting results should not be political... well except when the experiments involve living beings or could hurt living beings, but that's more about ethics and regulations on types of experiments allowed. But the research, the data collected, the communication of results through publications and conferences should not be silenced or manipulated for a persons or funding agencies own political views. Now I'm sure it's not quiet so black and white and a bit more grey then I've written here, but lets move on to the scientists. Should scientists be involved in politics? Yes! At the very least, only with informed decisions can we have good policy. The ultimate end goal of science is to understand the world around us and help improve our lives in it. Often this means that science and research is seen as turning into technology or medical advances, but it also leads to policy and regulations. Take for instance seismology. Understanding how earthquakes propagate, and how large they are likely to be has informed building codes. Or how about my beloved space weather? Well, there's a space weather research and forecasting bill introduced to the senate right now looking at understanding what the effects are on power grids and oil pipelines as well as on aviation and many other aspects of our lives. And of course there is the big one, climate science.... but I don't think we need to go into that here. Since much of science can inform policy, we need scientist to be involved in politics and to communicate this information. Scientists also need to be involved in politics to make sure that this pipeline stays open. We saw earlier this year how the government felt that it was appropriate and perfectly fine to gag scientists, not allowing them to speak as well as "reviewing" the data and results before they went public. Sure we sometimes have to do this to make sure the research is not classified or competition sensitive, but what they were starting went well beyond this, removing already public data. The government also make policies which effect scientists! For instance here's a list of some of the current and recently passed legislation that could effect my field: 1) The Space Weather Research and Forecasting act 2) The Inspiring the Next Space Pioneers, Innovators, and Researchers and Explorers (INSPIRE) Women Act 3) To direct NASA to return humans on the moon and to develop a sustained human presence on the moon 4) A manifest for human space flight And many many more. Some dictating the way lab waste is treated, others discussing what federal regulations contractors have to follow or not follow, and a few more on humans in space or going to the moon or mars. Many if not all have been advised at some point by scientists. And scientists should be commenting on them all! Anyone with an interest in space weather research should read and write/call your representatives about them! And for the last and most important reason... Which really should be self explanatory... Scientists are citizens and it is our civic duty to be involved in our government. This post has been re-published with permission from AlexaHalford.weebly.com  Name: Ian Cohen
Institution (Location): The Johns Hopkins University Applied Physics Laboratory (Laurel, MD) Degree(s): Ph.D., Physics, University of New Hampshire, 2015; B.A., Astronomy & Physics, Boston University, 2010 Current and past missions/projects: NASA Magnetospheric Multiscale (MMS), NASA sounding rocket program (RENU2, MICA, ACES missions) Research Interests: Plasma physics; magnetosphere-ionosphere coupling (specifically ion outflow, auroral dynamics, and ionospheric feedback); energetic particle dynamics; plasma and energetic particle instrumentation
 Next week I'll be heading to Florida for a very different kind of workshop. At least a very different type of workshop for me. I'll be going to the International Forum for Space Weather Assessment. We'll still be talking science, but instead of talking about our latest research we'll be looking at our field and trying to determine how we're doing.
The planning for this workshop started late last year, but it now seems to have an increased awareness surrounding it. With the President's proposed budget massively cutting research spending, and an apparent public distrust of science research, it seems like a great opportunity for scientists to take some time for self reflection. How are we doing as a field? Are we making progress towards a better understanding of the world around us? Where could we improve the pipeline from research understanding to operations and technology, ultimately to benefiting society? We do ask these questions fairly regularly, both as an individual and as a community. When we write papers we have to put our research and the new results in context of previous work and understanding. When writing proposals we must state how this proposed research builds off of previous understandings and might bring light to a question which has yet to be cracked. When refereeing those papers or grant proposals, we must rank the author/proposer's assessment of where their work stands. We ask these questions when we propose conference sessions, and after conference sessions at diner with colleagues or later in the evening over drinks at the bar. However, those conversations don't often make it down into writing. Granted, we're also not perhaps looking at the whole pipeline; from research to its impact on society. Once a year the Living With a Star (LWS) steering committee determines, with the help of the community, what areas are ripe for research and suggests grant calls with a specific bent on research that will ultimately benefit society. A couple times a decade we do take a slightly different, but a bit more far afield look at the entire field. These decadal and semi-decadal surveys try to summarize what big steps were made in the last 5 - 10 years and propose what are the most pressing research areas we as a field should pursue in the coming 5 - 10 years. The research in the decadal survey may not be called out to directly benefit society, but it all does progress our understanding of the world we live in. As it often takes more than 10 years to go from proposing a satellite mission to the launch and then many more years for the data to be analyzed, 10 years isn't necessarily a long term view. It may also take decades before we can determine what new theories and ideas are more correct than others. For instance, it was almost 20 years between the time when CRRES examined the radiation belts and Van Allen Probes were launched to revisit this location. As there are currently no new radiation belt mission planed, it may be another 20+ years before we can return again. Science is a slow process. Science may be a slow process, but we can still see how we're advancing which is really kind of cool! We see it in our ability to provide better space weather forecasts with more accurate models. We see it in the evolution of our theories. We see it in the new discoveries we find when we send new sensitive instruments into space. But a lot of that is qualitative. Can we show our progress more quantitatively? We think so, and that is one of our major goals for the workshop in Florida. This is all still a work in progress, so if you have comments/suggestions/would like to join the group, please let us know! Below I've outlined a few of the different approaches we're hoping to take. If you want to follow along with our progress check out our working group website. Application Readiness Levels: The first way we have proposed to track our progress is with Application Readiness Levels (ARL). ARLs are very similar to technology readiness levels (TRL) which are used for instrumentation, but instead are applied to a specific application. These were originally developed by the Earth Science Division at NASA (this is one of the divisions which would receive massive cuts from the budget, but that's a whole other post). We hope to use them for Space Physics and Space Weather applications. For instance, one of the applications we hope to track is our ability to predict satellite drag. Although we think of the atmosphere at the altitude of a satellite as almost non-existent, it still is significant. In fact, with changes in solar intensity and geomagnetic activity the density changes enough to increase the amount of drag on a satellite which leads to the satellite loosing altitude and ultimately de-orbiting unless it is moved back up. Probably the most famous satellites to have this done are the Hubble telescope and the international space station. We have models that try to account for and predict the amount of satellite drag one would experience. With the ARL we can track how well the modeling currently does as well as identify where we may need to improve our understanding, gather more data for inputs to the models, and ultimately refine our forecasts. Tracking Usage of Data: Citations are perhaps the standardized testing of science and may not always be the best way to determine an increase in understanding, but it is something that is nice and quantitative. The results from looking at how often a data set is used in published work probably shouldn't be taken alone, but it does often show a trend. The question that we hope this type of examination will answer is how many people use the data from a specific mission. Do only people who were on the mission team use the data, or does the community (both US and international) see it as value added to their studies? The more people who use this data set may imply the usefulness of continuing to collect that type of data. Tracking Usage of Models/Forecasting/anomaly analysis: The data for this is perhaps going to be a bit harder to find. However, it would be incredibly useful to be able to track who our end users are, where they get the data/forecasts/research from, and how they use it. Some of this gets into a bit of a sticking point. For example, if a sudden event upset occurs on a spacecraft, it's hard to confirm that that indeed was the problem. We also need the help of end users for this as they are the ones who see when space weather affects them, and how well our forecasts are able to predict and inform them. They can also tell us if what we think is important information for them is indeed useful. We, the scientist, may think that it's important to predict whether a solar storm is going to produce a geomagnetic storm, but the end user may only care to know if the CME is going to hit the magnetosphere when their equipment is up during the day. Of course there are many other ways we can try to track our field's progress. Over the coming months as our group meets and starts to gather and analyze the data, I'll try to update you all on what we find. And if you have any suggestions, comments, ideas, let us know! republished and modified with permission from AlexaHalford.weebly.com First Full Mapping of Near-Earth Plasma Transport Achieved, Thanks to the Van Allen Probes3/27/2017 This post is written by Solene and it deals with her recent work. We hope you'll enjoy the ride!  Maps are developed to best describe what surrounds us. That is true on the ground, and it is also true in space. There, the most interesting maps are maps of traffic conditions, i.e., maps that tell us how fast transport is, and in what the direction the flow is, depending on location. The only slight difference is that in space we are dealing with plasma transport, ions and electrons, rather than flows of cars and trucks.
To detail traffic in space, we must know both the magnetic field and the electric field: how strong are they? In what direction are they pointing? But unlike the magnetic field, the electric field is very difficult to measure, especially close to Earth! To circumvent this challenge, scientists have made assumptions and used theoretical considerations, rather than observations, to draw a simple picture of what they think the electric field should be around Earth. This simple picture implies that the traffic conditions are as if the cold plasma was riding a giant merry-go-round, with the Earth in the center. In other words, the cold plasma is thought to rotate at the same speed as the Earth’s rotational speed, i.e., to be in corotation with the planet. Yet, this has not been proven experimentally. In fact, some sporadic particle measurements have already indicated that the merry-go-round picture was not quite right. Using data from the Van Allen Probe satellites, we managed to make the first ever comprehensive observations of plasma transport due to the electric field close to Earth. This is a technical feat that allows us to test our 50 year old theories, at last! And the results are exciting! Based on an analysis of more than 2 years of data, we confirmed that the cold plasma was not simply riding along a merry-go-round. In particular, we found that the speed and direction at which the plasma was drifting depended on the time of the day (or, in other words, that they depended on the location with respect to the Sun). We also found that, on average, the rotational speed of the cold plasma was 5 to 10% slower than that of the Earth. We must now understand why! In short, our observations offer new context to existing theories; theories that merit reviews in our ongoing quest to better understand near Earth space! For more information on that topic, you can:
Solene Our predictions of solar storms have not been very accurate until now – here's whyMiho Janvier, University of DundeeWhen a space hurricane was unleashed from the sun on January 7 2014, space-weather centres around the world sent out warnings. The hurricane was heading directly for Earth and was predicted to produce a strong geomagnetic storm. But then an unexpected thing happened: the storm bypassed Earth and headed for Mars instead. It confirmed that our techniques for predicting such events are not as accurate as we would like. I am one of the co-authors of a new paper that provides an insight into why the predictions were wrong and what we can do about this in future. Space storms are a regular part of our sun’s activity. These so-called coronal mass ejections are a by-product of dramatic events called solar flares. They happen in active regions of the sun where a great amount of energy is built up in the form of a tangled magnetic field. This acts like a rubber band that has been twisted too far, snapping as it releases its stored energy. The geomagnetic storms that occur when these ejections hit Earth can have dramatic consequences. Beautiful auroras in the night sky might be sights to behold, but equally GPS and telecommunication systems that rely on satellites can be disrupted, while radio black-outs can make it necessary to re-route air travel. In the worst scenarios, there can be strong surges of electrical currents that cannot be supported by national electric grids. This can lead to major power outages, such as the one experienced by Montreal and the Quebec region in Canada in March 1989. Our findingsThe progress of the January 2014 solar flare in the sun’s atmosphere was monitored by the Solar Dynamics Observatory, a NASA mission launched in 2010 dedicated to our hosting star. Our research team, which was lead by Dr Christian Möstl from the Austrian Academy of Sciences, analysed the regions surrounding the storm’s original location on the sun. We found that the area surrounding it on one side was another intensely active region with a strong magnetic field, while the other side was occupied by a weak magnetic field called a “coronal hole”. The team concluded that the former strong field pushed the erupting storm away, channelling it into the weak field path and away from its original route. The flare behind the storm
Once the storm was on its way out into space, it was then recorded by several space probes, including the Advanced Composition Explorer in Earth’s orbit and the Curiosity Rover on Mars. In particular, the Martian robot reported a decrease in the cosmic rays in its vicinity, the so-called Forbush effect. This phenomenon takes place when the magnetic field of the solar cloud deflects the energetic particles, originating from outer space, which constantly bombard a planet. This data helped our team to build a model to reproduce the evolution of the solar cloud in space, and hence its arrival times, both at Earth and at the red planet. This should improve the models that scientists use for making real-time forecasts of space weather, such as those used by the UK MET Office space weather prediction centre, which opened in October 2014. In short, we reached two conclusions. For accurate forecasts, we will have to monitor the surroundings of the point of origin of the solar activity in future, since these appear to strongly dictate how coronal mass ejections develop. This will ultimately tell us whether a coronal mass ejection will hit the Earth, at which angle and with what intensity. Second, it is highly important that we continue to improve our models for describing how solar storms evolve once they leave the sun. This is what allows us to predict their arrival times at Earth, enabling national authorities to prepare for their consequences as accurately as possible. To do this, much more research is still required into areas such as the mechanisms underlying the ejection of solar storms, how they evolve in space and how they interact with a planet’s natural magnetic shields. That is a key challenge for my field in the coming months and years. Miho Janvier, Lecturer in Mathematics, University of Dundee This article was originally published on The Conversation. Read the original article. Predicting daily space weather will help keep your GPS on targetBrett Carter, RMIT UniversityIt’s well known that severe space weather events – which are quite rare – can have a negative impact on our use of Global Positioning System (GPS) enabled devices. But our research, published in Geophysical Research Letters, shows that another form of space weather – which occurs on a daily basis – can cause problems for GPS too. Knowing how to predict – or forecast – these daily space weather events is the key to protecting those people and industries who rely on GPS. The awareness and use of the GPS has dramatically increased over the past few decades, no doubt in part due to the availability and affordability of in-car satellite navigation systems and GPS-capable smart phones. But the use of GPS in industries in Australia, including agriculture, mining and construction, has also dramatically increased and is expected to boost the nation’s economy by up to A$13.7-billion by 2020. This increased use and reliance on GPS in particular has actually increased our society’s vulnerability to space weather. As detailed in other online articles, space weather influences our use of many space-based technologies and assets around the world. Disturbances in the ionosphereA common, but much less reported, aspect of space weather is a plasma disturbance that occurs in the Earth’s ionosphere during the night-time hours, called equatorial plasma bubbles. As the name suggests, these disturbances take place in the vicinity of the magnetic equator, such as South East Asia and Northern Australia. In some longitude sectors, such as across Africa, these plasma bubbles occur almost every night all year round. 
The process responsible for the onset of these ionospheric disturbances does not involve energetic explosions on the sun’s surface, like the commonly known solar flares and coronal mass ejections. Instead, plasma bubbles are internally driven disturbances in the ionosphere that happen on a day-by-day basis. After sunset, low electron density plasma from the lower ionosphere rises up into the high electron density plasma in the upper ionosphere, similar to a light fluid rising into a heavy fluid. This process is known as the Generalised Rayleigh-Taylor instability. The steep gradients at the edges of the bubble generates plasma waves, or turbulence. A break in the signalThis turbulence scatters radio waves that travel through it, such as the radio signals used in satellite communications, and in the positioning, timing and navigation of GPS. The result on the ground is that the received signal begins to randomly fluctuate in amplitude and phase (an effect called ionospheric scintillation) and becomes unrecognisable by the receiver. This regularly causes the satellite-to-ground radio link to become completely severed. When using GPS, this only really becomes a problem when the receiver loses several satellites simultaneously, which is common at locations close to the magnetic equator because of these plasma bubbles. But in the cases where only one satellite is being used, such as satellite communications, losing lock on the primary satellite has obvious negative implications. 
A recent study investigated the potential impact of plasma bubbles in an event when radio communications failures occurred during a fatal engagement between US combat soldiers and Taliban fighters in Afghanistan. Due to the broad radio frequency range affected by these plasma disturbances, affected applications also include other forms of satellite signals and communications; for example, satellite cellular communications and television broadcasting. Forecasting the bubblesCurrently, there does not exist a non-experimental and openly available model or online product that informs people of potential GPS disruptions due to plasma bubbles. This is largely because there is still a lot that we do not understand about these disturbances. Scientifically, the seasonal behaviour of plasma bubbles is relatively well understood, but why they happen on one day and not the next is still a significant and ongoing challenge in ionospheric physics. As such, a key research goal within this particular field is to develop a reliable day-to-day space weather forecasting capability specifically for plasma bubbles, in a similar manner to the traditional “rainy day” forecasts given by meteorologists. Our study used an artificial neural network (ANN) prediction algorithm, which is a self-learning program that is trained using a given dataset of several parameters. In this case, those parameters were several solar wind quantities measured by the Advanced Composition Explorer spacecraft, which is located at the Lagrangian point L1 between the sun and the Earth. The algorithm used this data to predict the level of geomagnetic activity resulting from the solar wind measured. Outputs from this prediction algorithm were combined with physics-based upper atmospheric modelling to attempt to predict the onset of these disturbances. We were able to show up to 95% accuracy in plasma bubble prediction, potentially giving anyone affected by ionospheric scintillation a number of hours notice of potential disruptions. With such forecasts, people and industries relying on GPS will be able to plan and account for these disruptions before they occur. Some geomagnetic activity is useful for GPSOur results also showed that common and low-intensity geomagnetic storms, which are associated with plasma disturbances from the sun’s surface, can effectively stop the equatorial plasma bubbles from ever growing and causing disruptions on GPS. This is important because during the peak bubble seasons (from February to April and from August to October in the Australasian region), the conditions are ripe for plasma bubble growth everyday. We showed that geomagnetic storms change the global upper atmospheric wind system in a way that prevents the bubbles from growing at the equator during these periods, and this was well supported by our GPS observations. These geomagnetic disturbances from the sun stop the bubbles from growing, and therefore provide opportunities for people to continue to use GPS at night-time during these peak plasma bubble seasons. So, for those who use GPS at low-latitude locations – including in South-East Asia, the Pacific, South America and Africa – a geomagnetic disruption from the sun will actually help to stop GPS scintillation events after sunset at times of the year when scintillation events normally occur every night. Brett Carter, Postdoctoral Researcher in Space Weather and Ionospheric Physics, RMIT University This article was originally published on The Conversation. Read the original article. |
AuthorA bunch of us Space Nerds Archives
July 2017
Categories
All
|
 RSS Feed
